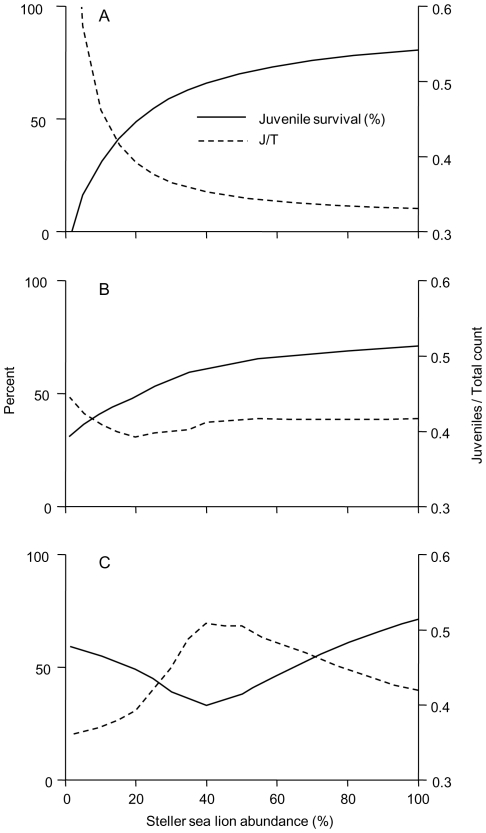
Figure 4. Juvenile survival and the juvenile fraction modeled as a function of Steller sea lion abundance.
Juvenile survivorship is shown as the percentage of all juveniles ages 2–4 years that survive to the end of a year. The J/T metric is the count of all juveniles ages 2–4 years divided by the count of all ages 2–31 years (excluding only pups). (A) The Flat numerical response. (B) The Linear numerical response. (C) The Sigmoid numerical response.

