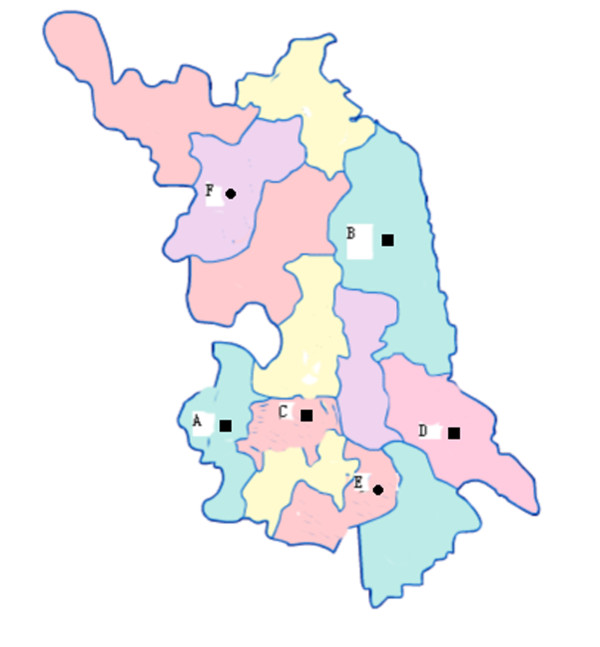
Figure 2.
Geographic distribution of the pig herds involved in this study. Black sphere(●) represents samples collected in 2010 and black square(■) represents samples collected in 2009. English alphabet represents the herds in different parts of the Jiangsu; A in Nanjing, B in Yancheng, C in Zhenjiang, D in Nantong, E in Wuxi, and F in Suqian.

