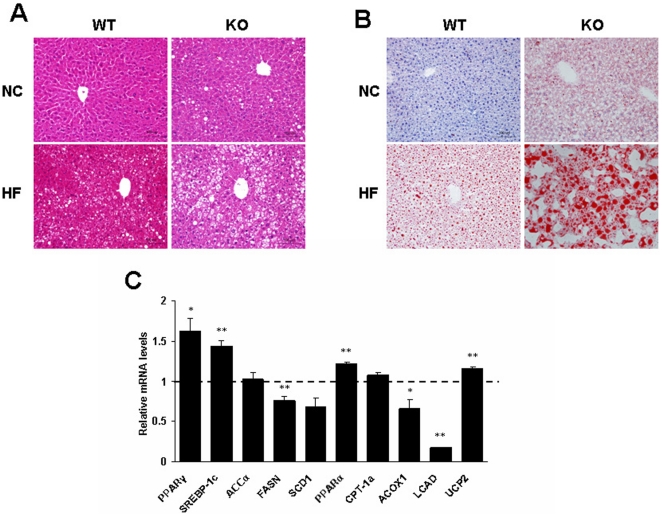
Figure 3. RGS5 deficiency exacerbated fat accumulation in liver.
A Histology of liver with hematoxylin-eosin. B Histology of liver with oil red O. C Expression levels of mRNA related to fatty acid metabolism in the liver of WT (a dotted line at value 1) and KO (black) mice fed an HF for 24 weeks (n = 6). Values represent means ± SEM. *p<0.05 and **p<0.01 compared with WT mice.

