Figure 3.
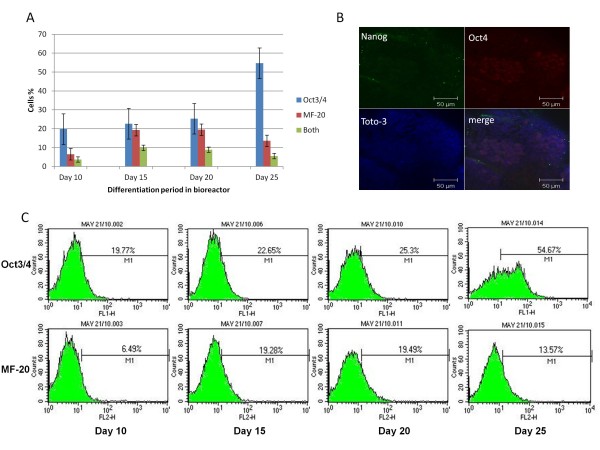
Expression of pluripotency and cardiac markers after 25 days in suspension culture. A) Fluorescence-activated cell sorting (FACS) analysis of Oct4 and MF-20. The percentage of cells expressing Oct4 increased from 20% to 54%. The maximum percentage of cells expressing MF-20 was on day 20 and declined afterward. A population of cells was expressing both markers at the same time during differentiation. Statistical analysis (ANOVA) was performed using GraphPad Prism4 (GraphPad Software) and significance was set at p < 0.05. B) Confocal microscopy confirmed the expression of Oct4 and Nanog in a sub-population of cells 20 days after differentiation in bioreactor. C) Distribution of cell populations in suspension culture system as revealed by FACS analysis of Oct4 and MF-20 genes.

