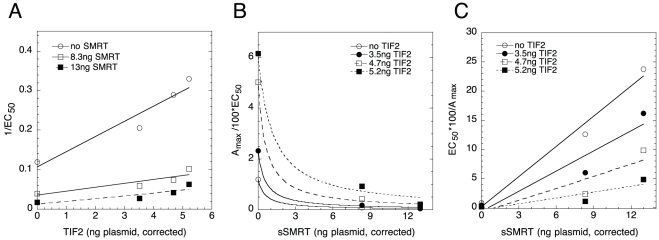
Figure 5. Analysis of combined actions of TIF2 and sSMRT for induction of the endogenous gene, IGFBP1.
Plots of (A) 1/EC50 vs. TIF2, (B) Amax/100×EC50 vs. sSMRT, and (C) EC50/Amax vs. sSMRT. The results of one representative experiment of a total of four independent experiments, conducted similarly as in Fig. 1, are shown for the indicated amounts of transfected NCoR and sSMRT plasmids, after correction for non-linear protein expression. The differences are that IGFBP1 mRNA (instead of luciferase) was determined by qRT-PCR and fold-induction is used in place of Amax (see text).

