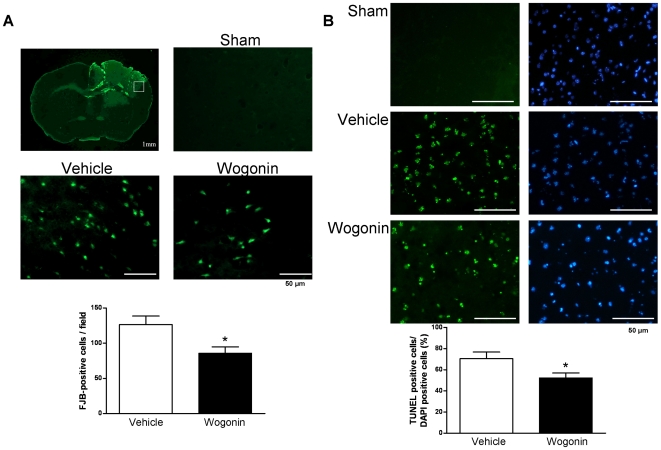
Figure 3. Effects of 40 mg·kg−1 wogonin treatment on neuronal degeneration and apoptotic cell death.
(A) Brain atlas of coronal sections of a core contusional region at 0.74 mm from the bregma. Quantification analysis indicated that wogonin-treated mice had significantly fewer degenerating neurons than vehicle-treated mice in the cortical contusion margin at day 1 post-TBI. The total number of Fluoro-Jade B (FJB)-positive cells is expressed as the mean number per field of view (1.3 mm2). The scale bar is 50 µm. (B) Representative terminal deoxynucleotidyl transferase-mediated dUTP-biotin nick end labeling (TUNEL) staining (green)- and DAPI (blue)-stained brain sections of a sham-injured control, a wogonin-treated mouse, and a vehicle-treated mouse at day 1 post-TBI. Quantification showed that wogonin-treated mice had significantly fewer TUNEL-positive cells than the vehicle-treated mice in the cortical contusion margin at day 1 post-TBI. The percentage of TUNEL-positive cells is expressed as the number of TUNEL-stained nuclei/the total number of DAPI-stained nuclei. Sections were stained with DAPI (blue) to show all nuclei. The scale bar is 50 µm. Values are presented as means ± SEM; *P<0.05 versus vehicle-treated injured mice (n = 7 mice/group).

