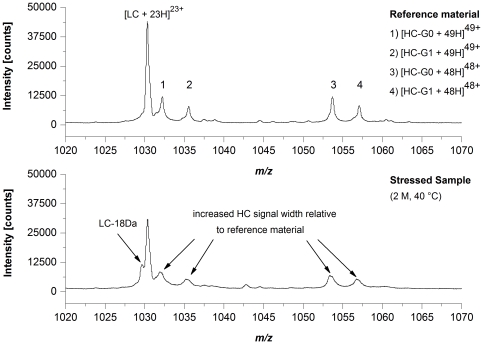
Figure 5. ESI-QTOF mass spectrometry of reduced Mab1.
NanoESI-QTOF mass spectra of Mab1 reference material and Mab1 stressed sample (stored at 40°C for 2 month). The spectra were recorded in the positive ion mode using acetonitrile/water/formic acid (79/20/1, v/v/v) as solvent. LC, light chain; HC-G0, non-galactosylated heavy chain; HC-G1, mono-galactosylated heavy chain.

