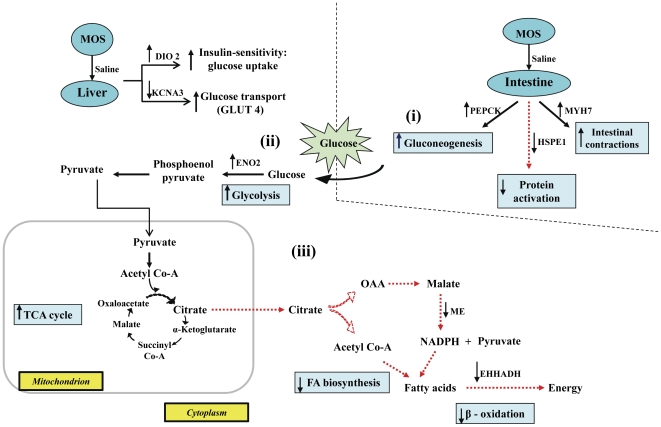
Figure 3. Schematic illustration of the effects of MOS versus VIRG on glucose metabolism in control hosts.
(i) MOS increased intestinal gluconeogenesis by up-regulating PEPCK; (ii) the high glucose influx into the liver was rapidly metabolized by glycolysis as mediated by ENO2 up-regulation; (iii) TCA-derived energy from glycolytic substrates, down-regulated ME and EHHADH which reduced fatty acid synthesis and β-oxidation, respectively.

