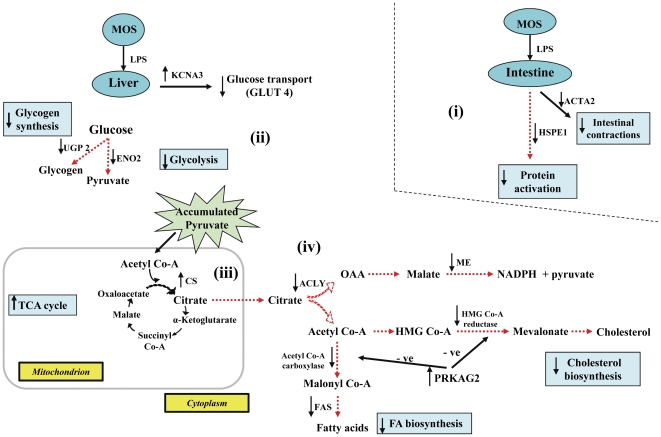
Figure 6. Schematic illustration of LPS effects on glucose metabolism between MOS- and VIRG-fed hosts.
(i) LPS caused no major intestinal metabolic activities in MOS-fed hosts; (ii) in absence of liver glucose mobilization, KCNA3 was up-regulated, whereas ENO2 and UGP2 down-regulation reduced glycolysis and glycogen synthesis, respectively; (iii) CS up-regulation increased TCA cycle-derived energy from high liver pyruvate; (iv) ACLY, ME and FAS down-regulations inhibited liver fatty acid biosynthesis; whereas PRKAG2 up-regulation inhibited fatty acid and cholesterol biosynthesis.

