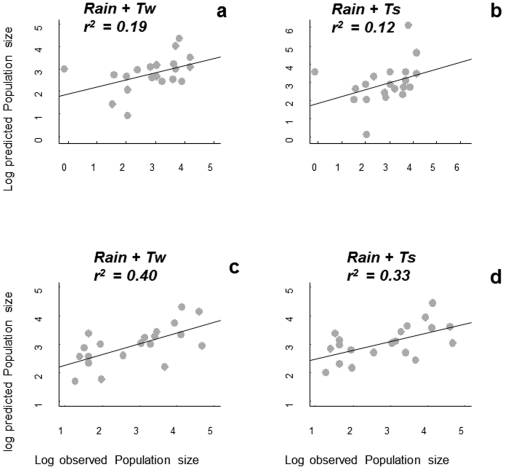
Figure 3. Upper row: comparison of observed Veronica hederifolia population densities in the minimum-tillage system versus predicted densities from models fitted to the data from the no-tillage system; lower row: comparison of observed Veronica hederifolia densities in the no-tillage system versus predicted densities to the data from the minimum tillage system.
a) Model 6, b) model 7, c) model 13, d) model 15. All models are from Table S1.

