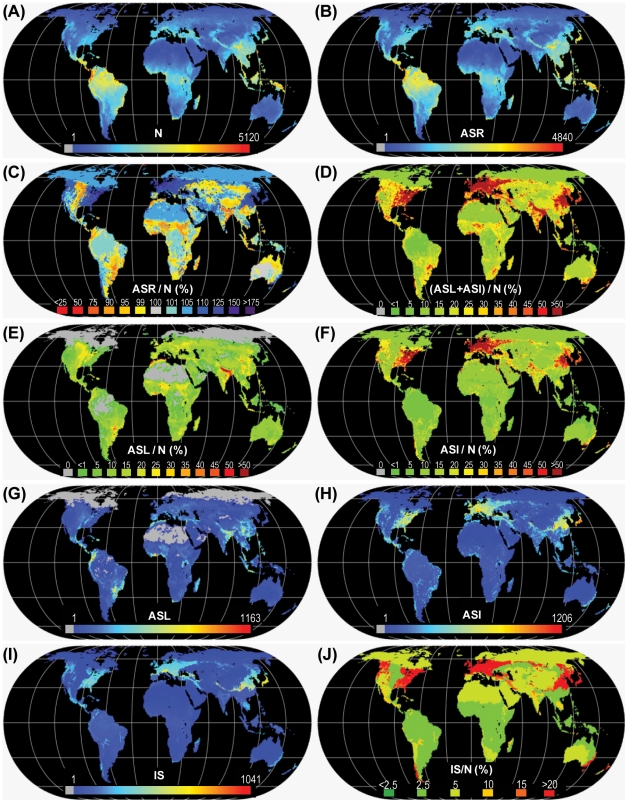
Figure 1. Global maps of (A) Native species richness (N), (B) Anthropogenic species richness (ASR), (C) Anthropogenic species richness (ASR) relative to N, (D) total anthropogenic species loss (ASL) + anthropogenic species increase (ASI) relative to N, (E) ASL relative to N, (F) ASI relative to N, (G) ASL, (H) ASI, (I) exotic species invasions (IS), (J) IS relative to N.
All maps in Eckert IV global equal area projection.

