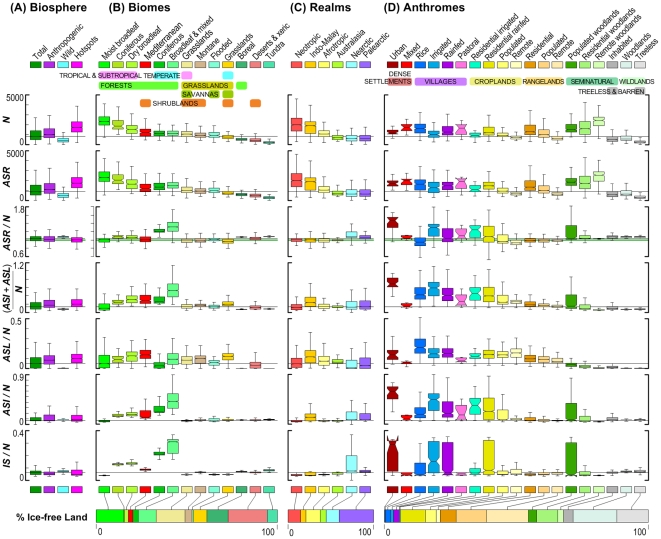
Figure 3. Global patterns of plant species richness and its changes across (A) the terrestrial biosphere, (B) biomes (C) biogeographic realms and (D) anthromes.
Notch in box plots is 95% confidence interval for median; whiskers exclude outliers. Horizontal black lines are global medians; green line in ASR/N plot highlights ASR = N. Horizontal bar charts at bottom present class areas in proportion to their global area.

