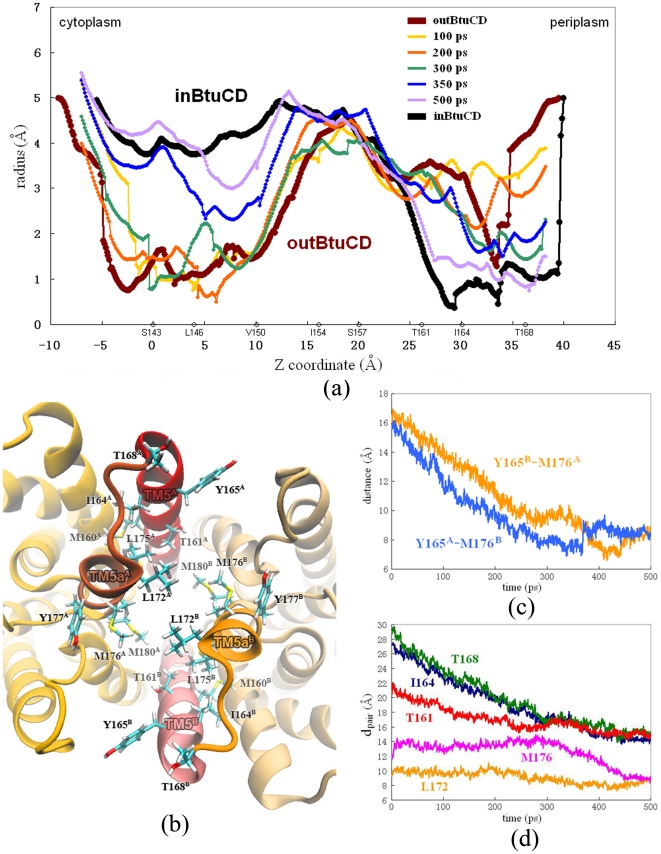
Figure 3. Conformational changes at the periplasmic side of the translocation pathway.
(a) Variation of the radius of the translocation pore during the O→I transition. The Z coordinate is along the membrane normal, and the layers denoted with residues are labeled. (b) Close-up top view from the periplasmic side of the translocation pore. Hydrophobic residues are shown with stick model. (c) Evolution of distances between Cα atoms on residues Y165 and M176 during the O→I transition. (d) Evolution of dpairs of residues at the perplasmic gate along the simulation trajectory of O→I transition.

