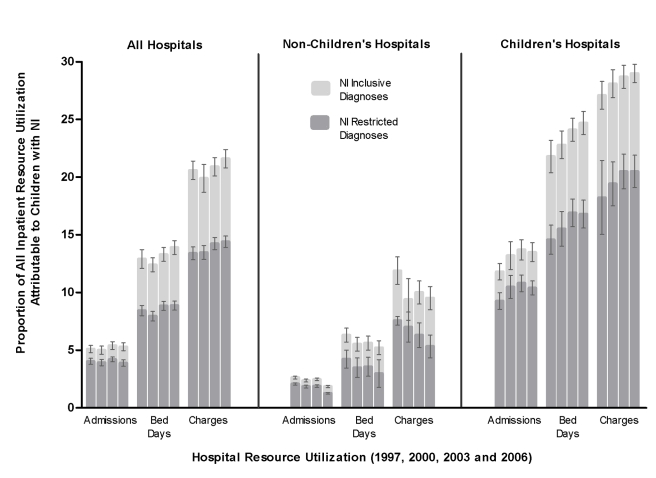
Figure 3. Inpatient resource utilization attributable to children with neurological impairment, Kids' Inpatient Database 1997, 2000, 2003, and 2006, by hospital type.
These graphs describe the proportion of all pediatric inpatient health resources attributable to NI from each year. Proportion (with 95% confidence interval) of total number of hospitalizations, hospital bed days, and total aggregate charges are shown for all hospitals, non-children's hospitals, and children's hospitals. Each bar represents 1 y of data. The four bars in each group represent data from 1997, 2000, 2003, and 2006.

