
Figure 3. Intergenic regions of adjacent genes in the putative operon were checked by Rt-PCR.
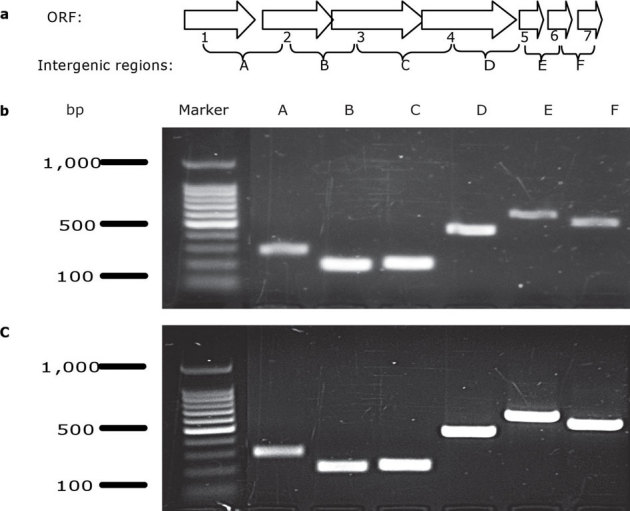
a, diagrammatic representation of the operon with open reading frames 1 7 and their intersections indicated with A F; b, amplicons with primers connecting intersections of the neighboring ORFs on cDNA; and c, amplicons with primers connecting intersections of the neighboring ORFs on chromosomal DNA positive control. No bands appeared in negative controls which employed cDNA amplified without reverse transcriptase in reactions.