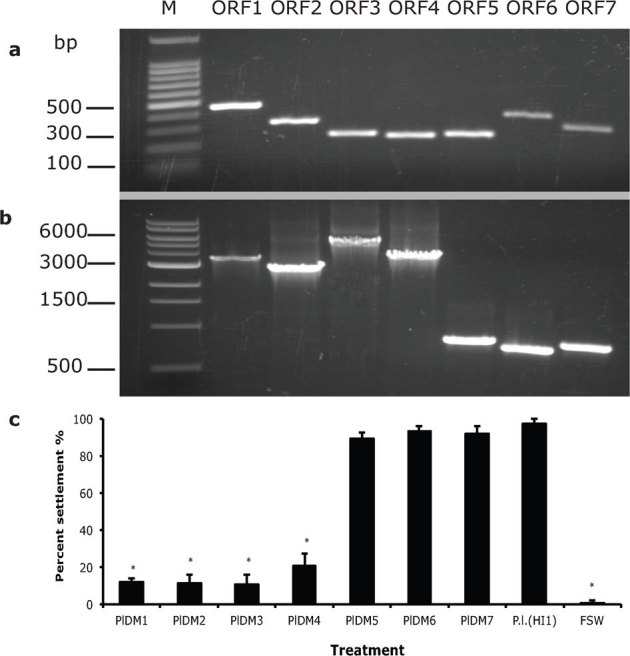
Figure 4. Deletion mutants of P. luteoviolacea (HI1) and analysis of their inductive capacity.

a, amplicons with primers complementary to flanking regions of each ORF from deletion mutants PlDM1 to PlDM7 (M: DNA Marker); b, amplicons with the same primer sets from wild type P. luteoviolacea (P.l. (HI1)); c, settlement (%) of H. elegans on biofilms made from deletion mutants PlDM1, PlDM2, PlDM3, PlDM4, PlDM5, PlDM6, PlDM7 and wild type P. luteoviolacea (HI1). Clean Petri dishes filled with FSW were negative controls. Bars represent mean percentages of larvae that settled in 24h +/ SD (n = 5). * denotes significant difference compared with P. luteoviolacea (HI1) (Kruskal-Wallis test, p<0.01).
