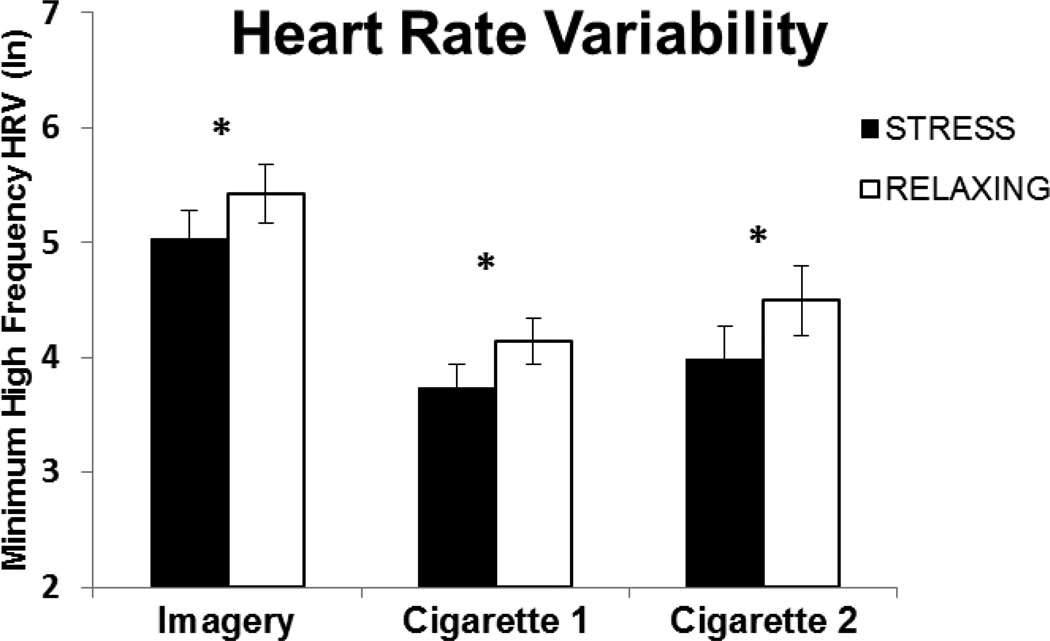
Fig. 1.
Mean (SE) minimum values of the natural log (ln) of the high frequency heart rate variability (HF-HRV) following stress or relaxing imagery (Imagery), end of the delay period (Cigarette 1) and following ad-lib cigarette smoking (Cigarette 2). Baseline values are the average of the 30 minutes prior to the imagery, stress baseline HF-HRV = 5.92 (SE=.17) and relaxing baseline HF-HRV = 6.01 (SE=.15). *p < .05 for paired comparisons

