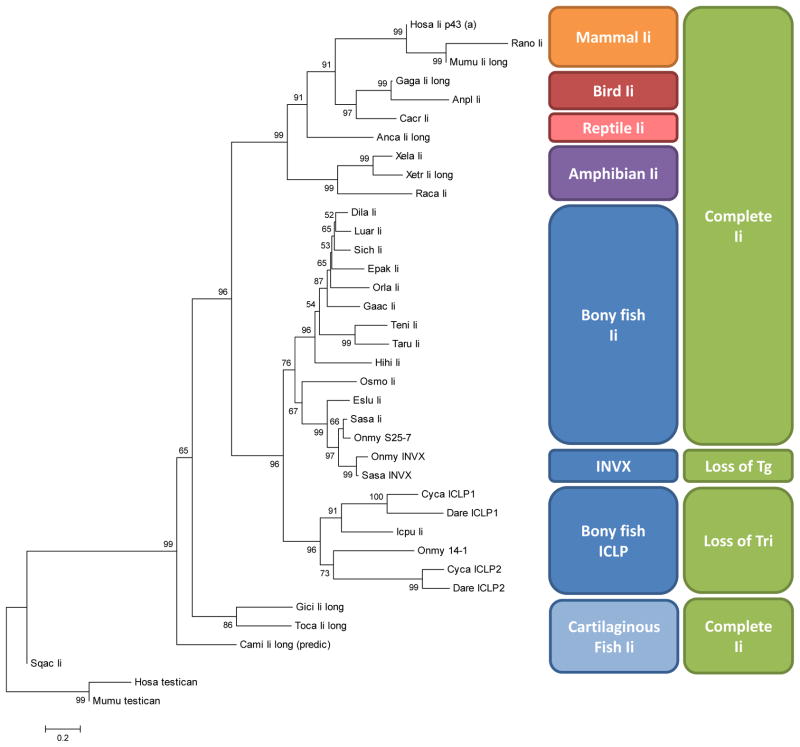
Figure 8. Cartilaginous fish Ii groups with other Ii in phylogenetic analysis.
Neighbor joining tree of Ii amino acid sequences aligned and analyzed in MEGA. Alignment (with sequences not included in this tree) is found in Supplemental Figure 1, sequence accession numbers and names given in Supplemental Table 2. Bootstrap values at nodes inferred from 1000 replicates. Evolutionary distance is shown with the scale bar in the units of amino acid substitutions per site. Boxes to the center-right highlight different vertebrate phylogenetic clusters of Ii and far right mark loss of Tg and trimerization domains in some teleost Ii forms, compared to the complete Ii.

