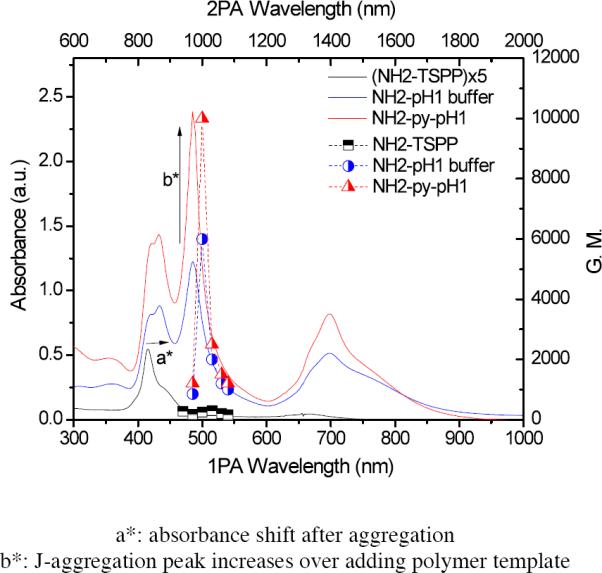
Figure 7.

Absorption spectra (bottom x-axis and left y-axis) of TSPP analog 5, in water (black line), 5 at pH 1 (blue line), and 5 with polymer in pH 1 solution (red line), and corresponding 2PA cross sections (top x-axis and right y-axis, each half filled symbols, respectively).
