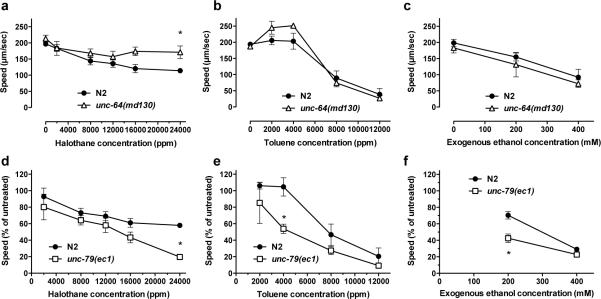
Figure 4.
Concentration-effect curves comparing the effect of halothane, ethanol and toluene on the crawling speed of wild-type and unc-64(md130) and unc-79(ec1) mutant strains. (a–c) Shown are unadjusted average speeds (±SEM) for the N2 strain and the halothane-resistant unc-64(md130) mutant strain. (d–f) Shown are relative speeds (% of untreated speed ± SEM) for the N2 strain and the ethanol-, toluene- and halothane-hypersensitive unc-79(ec1) mutant strain. Speeds are determined over a 2-minute period immediately following a 10-minute exposure to halothane or toluene or between minute 10 and minute 12 of ethanol exposure (N = 3–5 trials of 10 animals per trial). Symbol shows significant differences compared to 0 ppm: *, p < 0.05.

