Figure 5.
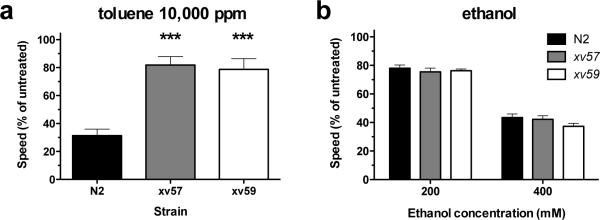
Toluene and ethanol responses of wild-type and two toluene-resistant mutant strains. (a) Average speed of locomotion (% of untreated speed ± SEM) determined over a 2-minute period following a 10-minute exposure to 10,000 ppm toluene is shown for N2, xv57 and xv59 young-adult animals (n = 5 trials of 10 animals per trial). (b) Average speed of locomotion (% of untreated speed ± SEM) between minute 10 and minute 12 of 200 mM or 400 mM ethanol exposures (N = 6–7 trials of 10 animals per trial). Symbols show significant differences compared to 0 ppm toluene: ***, p < 0.001.

