
Fig. 2.
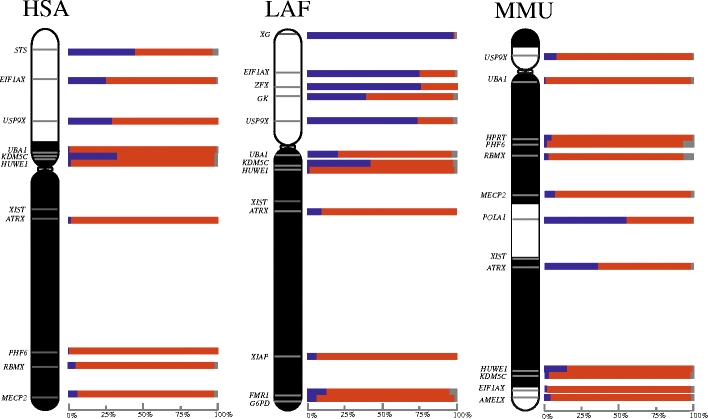
Activity maps of the human (HSA), elephant (LAF) and mouse (MMU) X chromosomes. Bars represent percentage of nuclei in which the X-borne test loci are transcribing from two (blue), one (red) or zero (grey) alleles. X conserved region is indicate in black. X added region is indicated in white