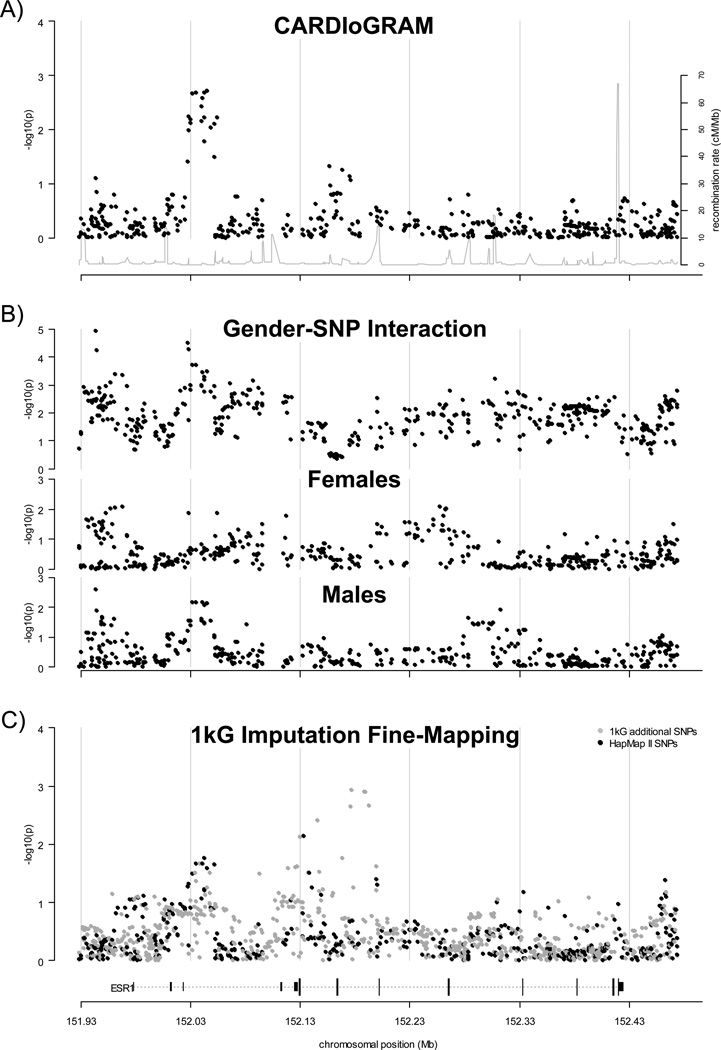
Figure 1.
Regional association results for the ESR1 gene region. Results of CARDIoGRAM global and gender-stratified meta-analysis and fine mapping analysis for a region of chromosome 6 containing the coding and non-coding exons of ESR1 and 50kb of the upstream and downstream flanking regions (−log10(p-value) shown as black points). Results shown are for a fixed or random effects meta-analysis in the absence or presence of between-study heterogeneity, respectively (see Methods). The position of the ESR1 gene is shown at the bottom of the plot (dotted line), with coding and non-coding exons shown as long and short vertical bars, respectively. Regional recombination rate (HapMap II) is shown as a grey line in plot A. A). Regional association plot of global meta-analysis results from the CARDIoGRAM study. B). Regional association plot of gender-stratified meta-analysis results from the CARDIoGRAM study. Results for the test for SNP-gender interaction are shown in the top panel; results for the association test in females and males are shown in the middle and bottom panels, respectively. C). Regional association plot of results from fine-mapping meta-analysis (MIGen, WTCCC and Framingham studies). Results for SNPs that were previously analyzed in the CARDIoGRAM study are shown as black points (i.e. SNPs that were directly genotyped or imputed using a reference panel of haplotypes generated from the Phase II HapMap CEU genotypes). Results for additional SNPs that were imputed using a reference panel of haplotypes generated using data from the 1000 Genomes project (August 2010 release) are shown as grey points.

