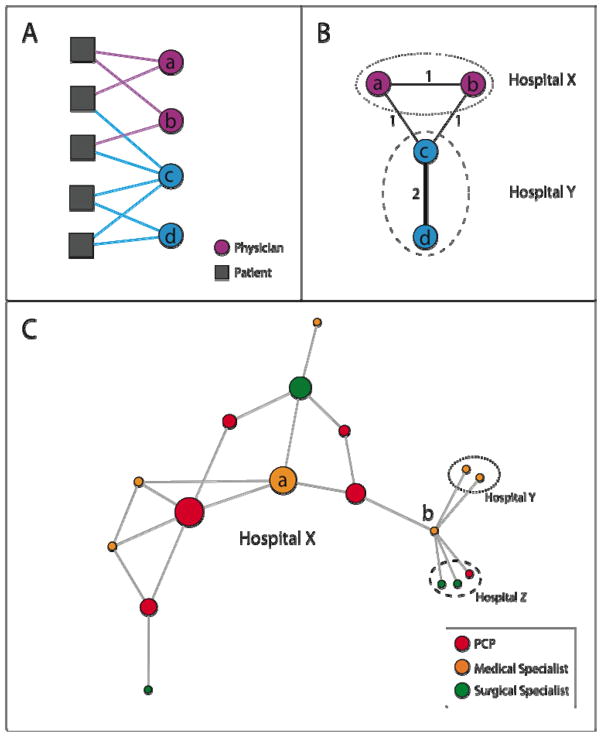
Figure 1. Schematic of Network Identification and Measurement Methods.
Figure 1A illustrates the observed connections between a hypothetical group of physicians and patients (denoted by solid lines connecting patients to physicians), the first step in creating a physician network. In Figure 1B, the group of patient-physician ties depicted in Figure 1A are transformed into a physician-physician network, where physicians are linked by a tie with strength equal to the number of patients they share. For instance, in Figs. 1A and 1B, physicians A and C share 1 patient, and physicians C and D share 2 patients. Also depicted in Fig. 1B is that physicians are assigned to hospitals, and their networks can extend within and outside their affiliated hospitals.
Figure 1C shows a simple network to illustrate the network measures used in this study. Each circle represents a physician and is colored by its specialty. The size of each circle is proportional to its betweenness centrality within hospital X (which by definition is 0 for physicians in hospitals Y and Z). The betweenness centrality measures the centrality of a physician in her network by quantifying how often the physician functions as an intermediary in the shortest paths connecting each physician to every other physician (see Appendix for details).
Degree: The adjusted degree measures how many colleagues physicians share patients with, adjusted for the number of patients they treat. In Fig. 1C, Doctor A has a degree of 4 because she is connected to 4 other physicians. Doctor B has a degree of 6. If Doctor A treated 10 Medicare patients in 2006, her adjusted degree would be 40 colleagues per 100 shared patients. Similarly, if Doctor B also treated 10 Medicare patients in 2006, her adjusted degree would be 60 colleagues per 100 shared patients.
Relative Centrality: Relative centrality measures on average, how central one group of physicians are compared to another group within a hospital network by taking the ratio of the average betweenness centrality of, for example, PCPs, versus other physicians in a hospital. In Hospital X, the PCP relative centrality is approximately 2.0, meaning that the PCPs in this network are on average about twice as central as other physicians. This is visually apparent when looking at the betweenness centrality of physicians, represented by the size of physicians’ circles in Fig 1C, where PCPs appear to have a larger overall share of the centrality than other physicians. The concept of relative centrality is illustrated with larger, real hospital networks in Fig. 2

