
Figure 3. Adjusted Estimates of Hospital Network Structure vs. Cost and Utilization Outcomes.
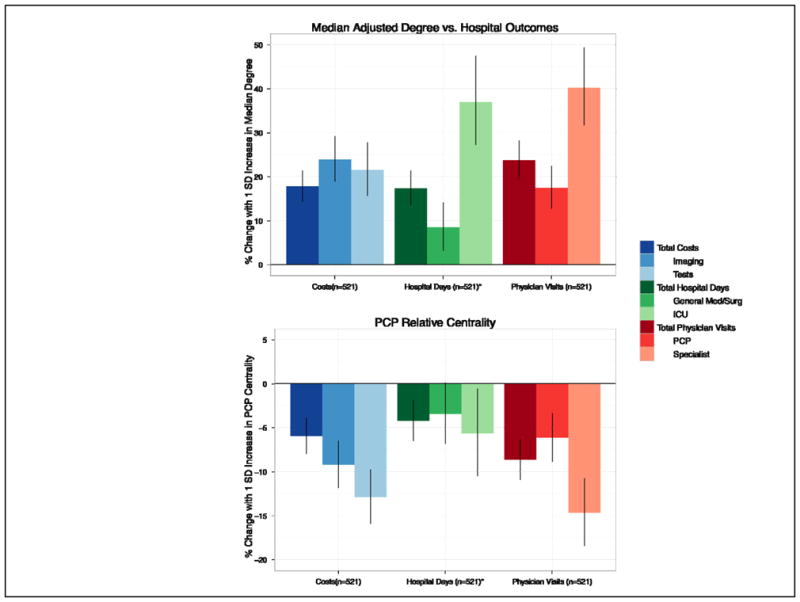
Each section represents the estimated effect of increasing a network measure (Fig 1A, median adjusted degree, Fig 1B, PCP relative centrality) by one standard deviation (SD) for the average-sized urban, non-profit, non-teaching hospital in our sample on three different cost, hospital day, and physician visit outcomes. All estimates are adjusted for several hospital characteristics described in the Methods, including hospital size, urban/rural location and case mix. Error bars show 95% confidence intervals for each estimate. *5 hospitals had missing data for the general medical/surgical and ICU hospital days outcomes, but did have data for the total hospital days outcome