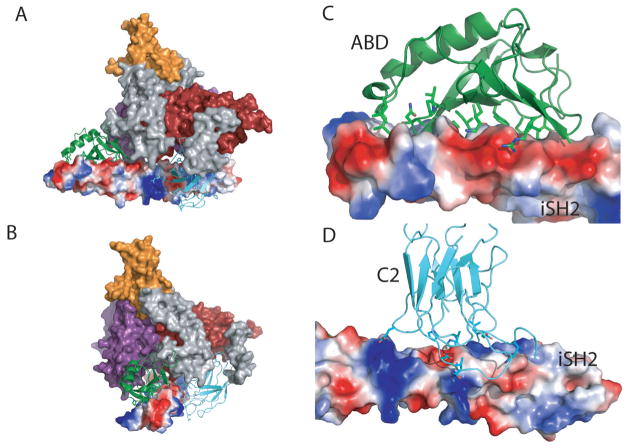
Fig. 2. Interaction between the iSH2 domain of p85 and the ABD and the C2 domain of p110.
(A) Molecular surface of the p110α /niSH2. The iSH2 is shown as a molecular surface colored according to electrostatic potential. The ABD and the C2 domain are shown as ribbons. (b) The same image rotated by 90°. (C) Close-up of the interaction between iSH2 and the ABD. (D) Close-up of the interaction between iSH2 and the C2 domain.

