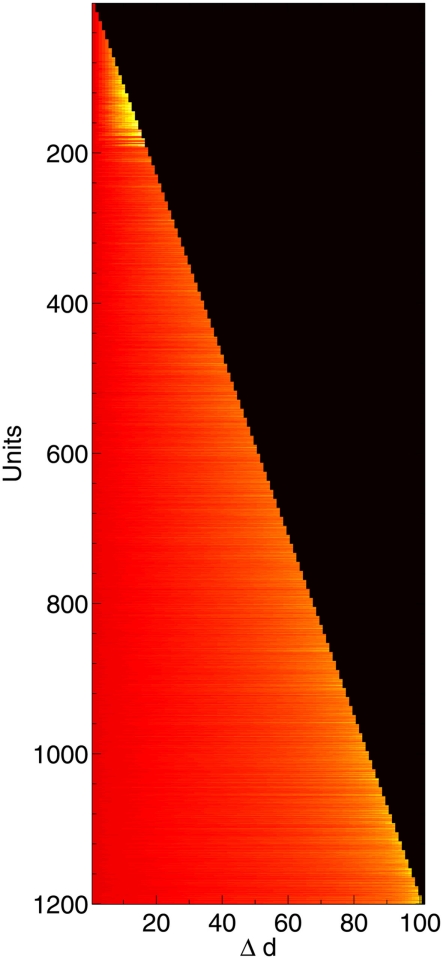
Figure 7.
Change in compensation factor c as 1200 neurons are deleted, shown along the time course of the network from initial lesioning to 100% deletion. Hotter colors (lighter shades) denote higher values of c. Neurons nearer the top were deleted first; neurons on the bottom row survived all the way to the end.

