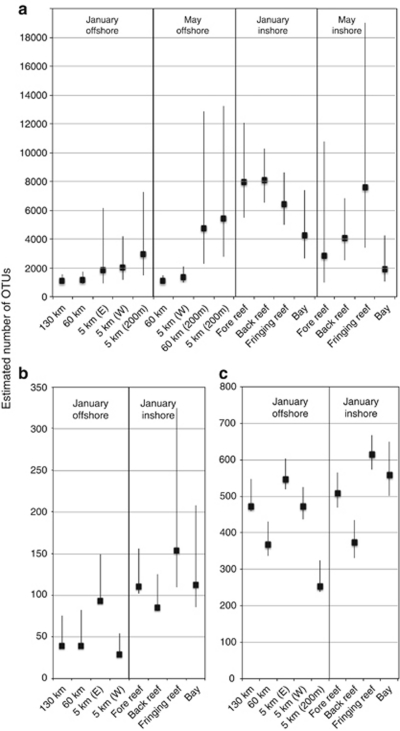
Figure 4.
Species richness estimates of: (a) bacterial, (b) archaeal and (c) eukaryotic OTUs with Bonferroni corrected 95% confidence intervals for all samples across a given domain. (W) and (E) indicate samples collected West or East of Avaroa Pass. Bacterial and archaeal estimates were calculated using CatchAll, whereas eukaryotic estimates were calculated using Chao2 as implemented in SPADE.

