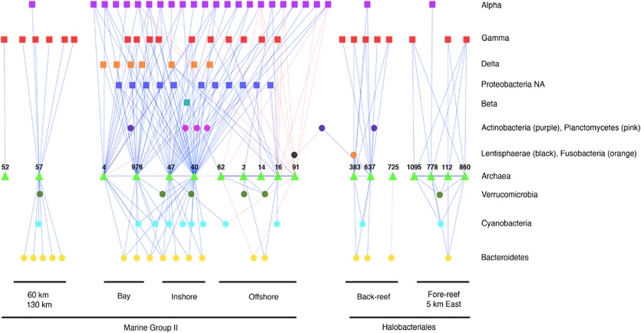
Figure 8.
Cytoscape network diagram of Pearson's correlations (lines) between archaeal OTUs and all other bacterial and archaeal OTUs (symbols) across sample habitats in January 2008. Archaeal OTUs represented were those with significant positive (solid lines) or negative (dashed lines) correlation (P<0.01) to other bacterial or archaeal OTUs. Numbers represent identification numbers of archaeal OTUs. Alpha, Beta, Gamma and Delta-Proteobacterial groups. All OTUs were classified by phylum/domain and horizontally aligned with group identification.

