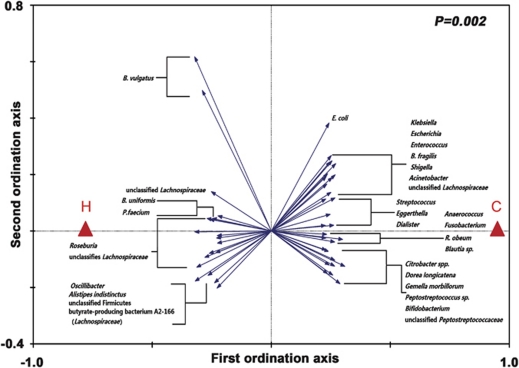
Figure 2.
Biplot of the RDA (redundancy analysis) based on the relative abundance of OTUs (98% similarity level). Constrained explanatory variables are indicated by red triangles: H represents healthy and C represents diseased. OTUs that have at least 5% of the variability in their values explained by the canonical axis are indicated by blue arrows. Upper right shows P-value of Monte Carlo Permutation Test. B, Bacteroides; P, Phascolarctobacterium; E, Escherichia; R, Ruminococcus.

