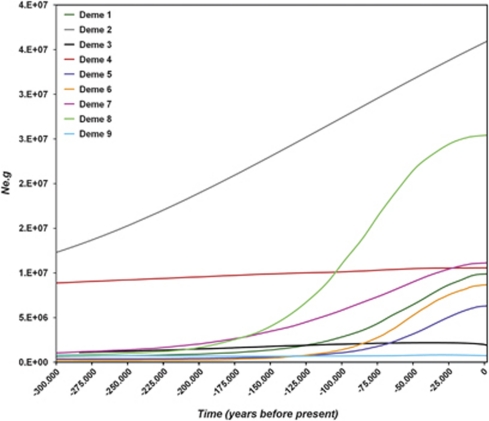
Figure 4.
Overlay of Bayesian skyline plot of all Phycodnaviruses' demes summarizing their individual dynamics over the last 300 KYBP. Several demographic signatures show a considerable increase in the number of lineages around 130 KYBP possibly during the warm Eemian interglacial period, reaching a plateau or reduction near the present. Demes 1and 2—Chatfield Reservoir (USA) and the South Platte River (USA); Deme 3—Chatfield Reservoir (USA), the South Platte River (USA) and Lake Ontario (Canada); Deme 4—Solimões River (Brazil); Deme 5—South Platte River (Canada); Deme 6—Cuieiras River (Brazil); Demes 7 and 9—Lake Ontario (Canada) and Deme 8—Lake Ontario (Canada) and Crawford Lake (Canada).

