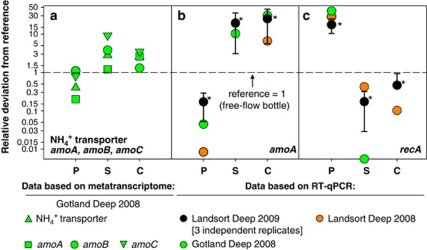
Figure 3.
Comparison of transcript abundances in PUMP-CTD and AFIS samples in relation to their references. Colors represent the investigated Deep: black, Landsort Deep (2009); orange, Landsort Deep (2008); green, Gotland Deep (2008). Deviations in gene expression were calculated by comparing PUMP-CTD or data of fixed samples with the accordant non-fixed free-flow bottle references. A factor of 1 denotes that the abundances were equal to those of the reference (marked as a dashed line). Investigated parameters were (a) abundances based on metatranscriptomics: thaumarchaeal NH4+ transporter, amoA, amoB and amoC transcripts. RT-qPCR-based abundances: (b) thaumarchaeal amoA transcripts; (c) ‘Sulfurimonas sp. GD1' recA transcripts. P, PUMP-CTD; S, stop solution; C, Carnoy fixative. *Based on mean±s.d. of three independent replicates, the non-parametric Mann–Whitney test showed a significant difference to the reference (P<0.01).

