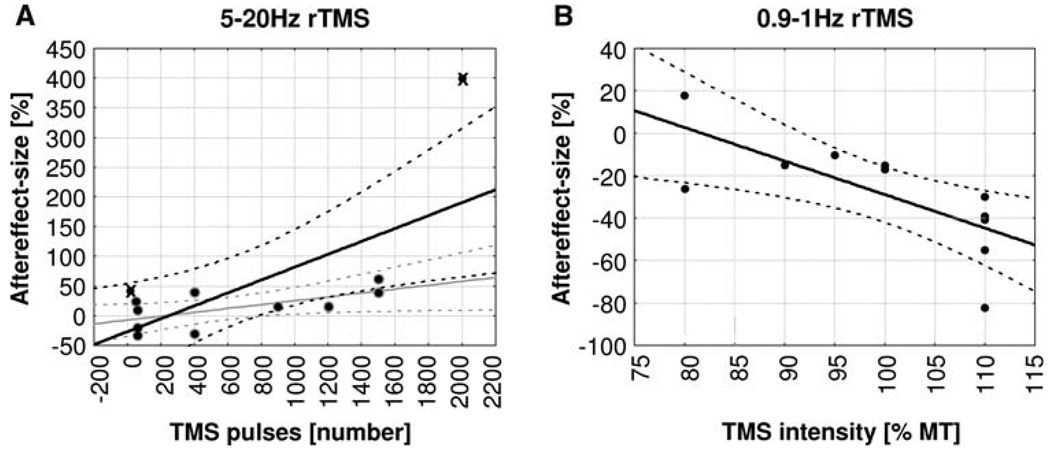
Fig. 2.
Linear correlations between aftereffect-size [%] and rTMS-parameters. a Aftereffect-size as a function of total number of TMS pulses applied in high-frequency protocols (5–20 Hz rTMS). Regression lines and 95% confidence intervals are shown for analyses including all data points (black lines) and excluding outliers (grey lines, outliers marked by crosses, see also text). b Aftereffect-size as a function of TMS intensity applied in low-frequency protocols (0.9–1 Hz)

