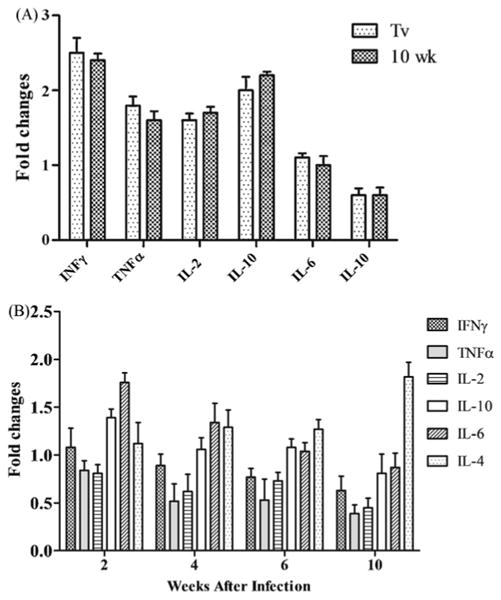
Fig. 3.

Comparison of the levels of rabbit cytokines as determined by SYBR-Green qRT-PCR. (A) Histograms representing the fold-changes (2−ΔΔCT) in the quantitation of cytokines in the FhSAP2-vaccinated group compared to the negative controls (samples collected before immunization). Light gray bar: samples collected 4 weeks after the last vaccination (Tv). Dark gray bar: samples collected 10 weeks after the challenge (T10). (B) Histograms representing the fold-changes (2−ΔΔCT) in the quantitation of cytokines in the non-vaccinated, infected rabbits at 2 weeks (T2), 4 weeks (T4), 6 weeks (T6) and 10 weeks (T10) after the challenge infection.
