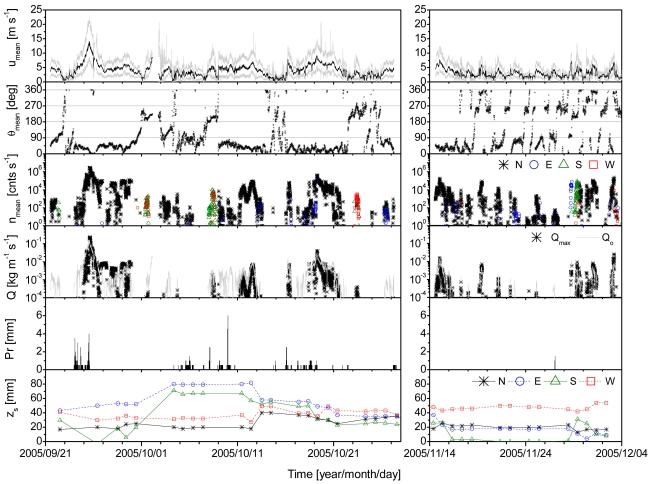
Figure 6.
Time series of 10-min averages of the horizontal wind velocity umean, horizontal wind direction θmean, blown-sand impact count nmean, estimated total aeolian sand flux Qmean, and precipitation Pr; the time series of QO estimated from Equation (13) and the daily sensor height from the ground surface zs are also shown. The solid gray lines in the top figure show the maximum and minimum instantaneous wind velocities. The wind direction is expressed clockwise from north, from 0° to 360°. Only the maximum nmean for the four directions in each of the 10-min intervals is plotted.

