
Figure 3.
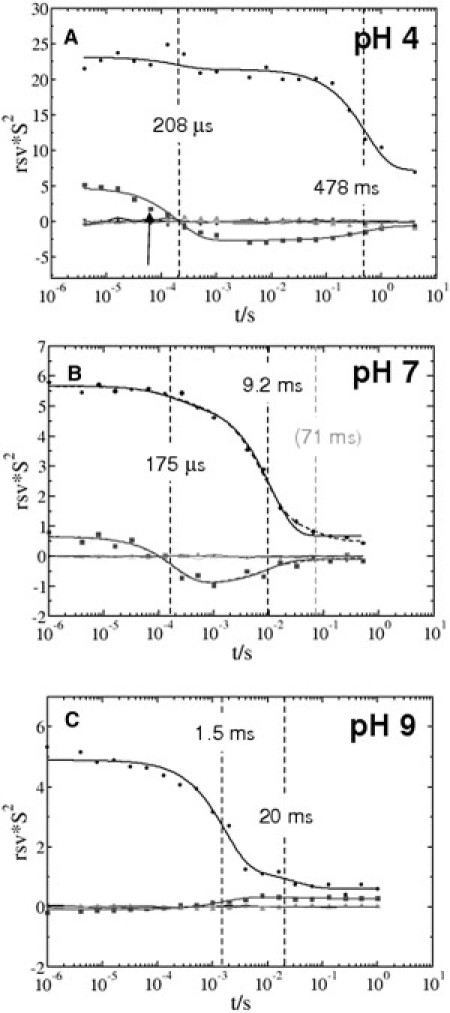
RSVs resulting from SVD of time-dependent difference density maps plotted against the pump-probe time delays. Two significant vectors were fitted using two exponentials (corresponding to the relaxations of two intermediates) at pH 4 (A), pH 7 (B), and pH 9 (C). The first RSV is represented by circles, and the second is represented by squares. The relaxation times of the pR (τ1) and pB (τ2) states determined by the fit are marked by vertical dashed lines. Dashed line in panel A: At pH 7, the two RSVs were fitted by a sum of three exponentials, indicating a third intermediate (pB2) at very low occupation with τ1 = 71 ms (gray dashed vertical line).