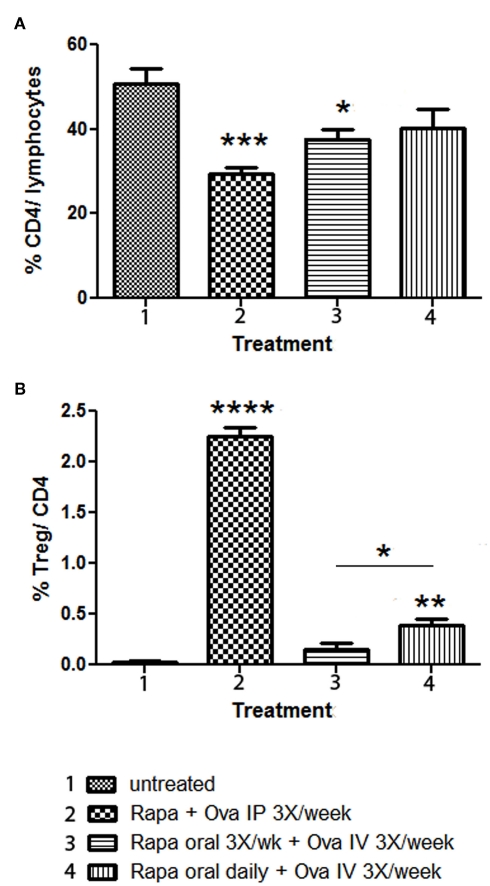
Figure 4.
Comparison of Rapa/specific peptide tolerization protocol using different routes and schedules of drug administration. DO.11.10-tg Rag−/− mice (n = 4 per group) were treated for 3 weeks with Rapa/ova-specific peptide, after which the spleens were harvested, and flow cytometry was used to determine: (A) percentage of CD4+ T cells of total gated splenocytes, and (B) percentage of CD25+FoxP3+ cells of CD4+ T cells. Statistically significant differences between each group and untreated (naïve) control mice are indicated as *P < 0.05, **P < 0.01, ***P < 0.001, and ****P < 0.0001. In (B), a statistically significant difference between mice that received rapamycin orally three-times per week or daily is also indicated.

