
Figure 4.
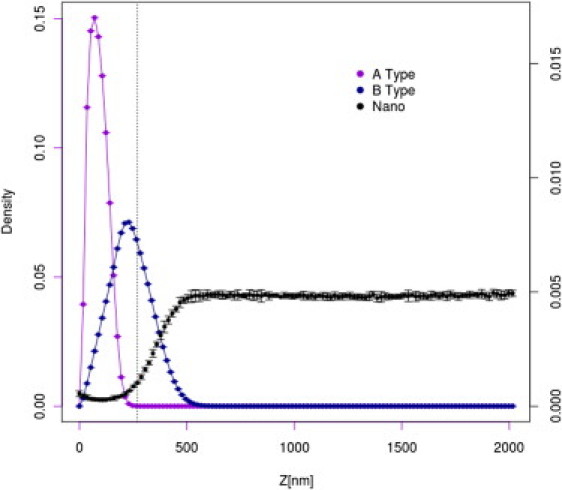
Distribution of A domains (purple), B domains (blue), and nanoparticles (black) for the AML layer (not covered by the gel layer) for the system with surface coverage equal to 0.05. For better readability, the scale for nanoparticle distribution is given at the right-hand side of the plot.