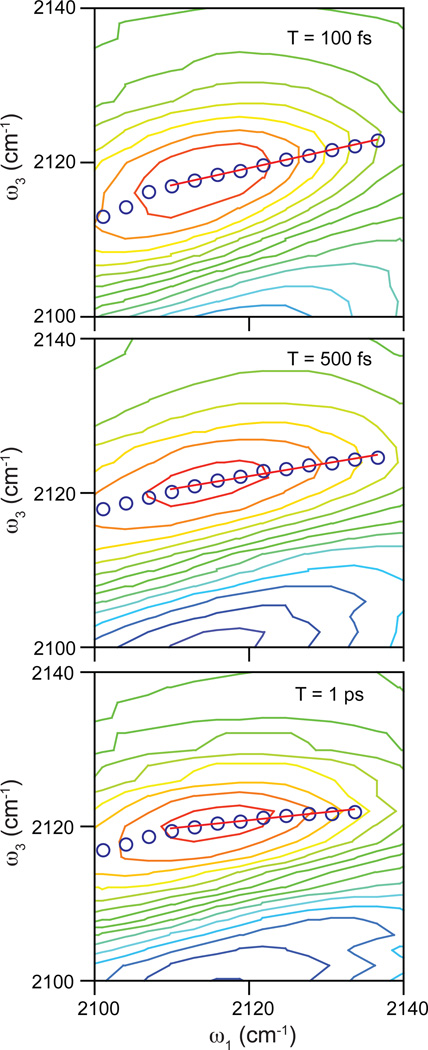
Figure 3.
Representative 2D IR spectra of PAAD+ in water for waiting times of 100 fs (top), 500 fs (middle), and 1 ps (bottom) focusing on the positive feature that we analyze to extract the frequency correlations. Blue circles correspond to the center line points determined from the spectrum. The red line is the linear fit to the center line.

