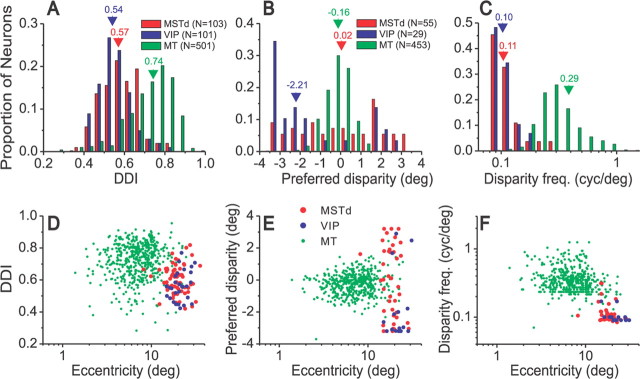
Figure 10.
Comparison of disparity selectivity in areas MSTd, VIP, and MT. A–C, The top row shows distributions of the DDI (A), preferred disparity (B), and disparity frequency (C) parameters. A, Data for all neurons tested: 103 MSTd neurons (red), 101 VIP cells (blue), and 501 MT neurons (green). B, C, Data for 55 MSTd cells and 29 VIP neurons that had significant disparity tuning (p < 0.01, one-way ANOVA) for the max DDI direction and were well-fit by the Gabor function (R2 > 0.8) (see Materials and Methods). The MT data in B and C represent 453 MT neurons with significant disparity tuning (p < 0.01) (DeAngelis and Uka, 2003). Numbers above arrowheads show the median values for each distribution. D, DDI is plotted as a function of receptive field eccentricity for neurons from MT (n = 501), MSTd (n = 65), and VIP (n = 28). E, Preferred disparity as a function of eccentricity (MT, n = 453; MSTd, n = 41; VIP, n = 15). F, Disparity frequency as a function of eccentricity, for the same samples of neurons as in E.

