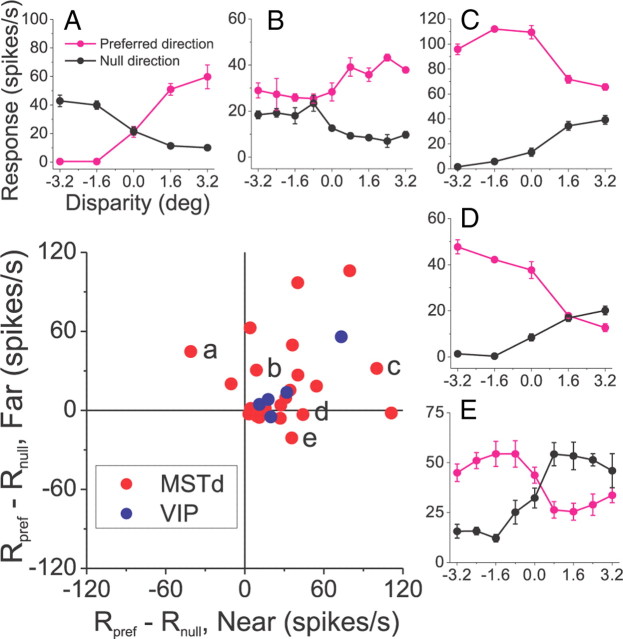
Figure 6.
Population summary of response patterns for DDD cells. For each neuron, the scatter plot shows the difference in average response between preferred and null directions at far disparities (ordinate) versus the corresponding difference in response at near disparities (abscissa). Data are shown only for DDD neurons from MSTd (red) and VIP (blue). A–E show disparity tuning curves for preferred and null directions for five different example neurons, corresponding to the labeled data points in the scatter plot.

