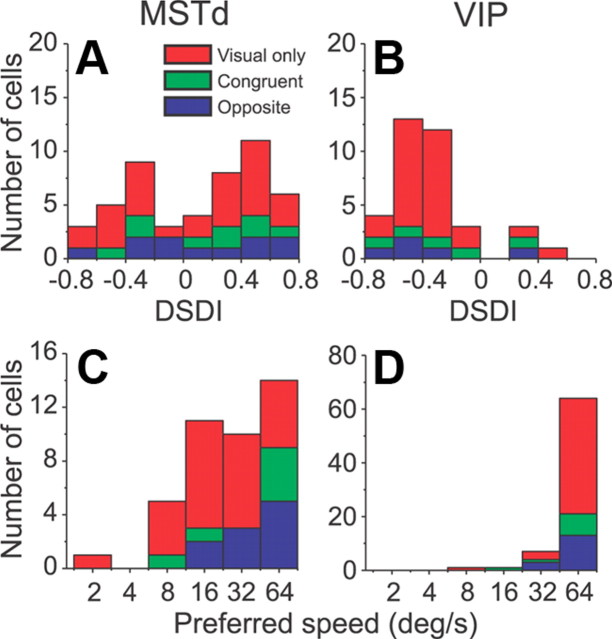
Figure 7.
Population summary of the DSDI and speed preferences. A, B, Distributions of the global DSDI (computed across all motion directions) for disparity-selective non-DDD neurons from areas MSTd (n = 49) and VIP (n = 36). C, D, Distributions of preferred speed for MSTd (n = 41) and VIP (n = 73) neurons. Data are color coded to represent visual only neurons (red) and multisensory congruent (green) or opposite (blue) cells.

