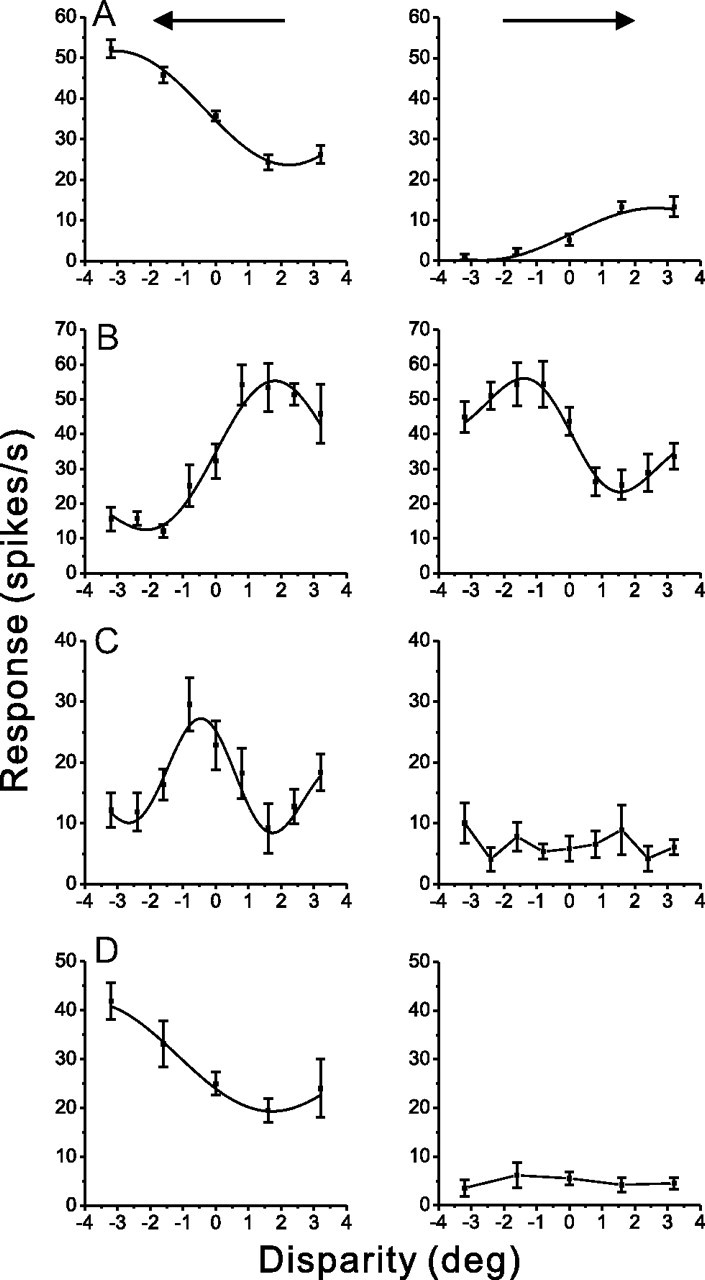
Figure 9.

Example disparity tuning curves and Gabor fits for MSTd and VIP neurons. For each neuron/row, disparity tuning is shown for the direction of maximum DDI (left) and for the direction 180° opposite to it (right). A–D, Data are shown for two DDD cells from MSTd (A, B), one non-DDD cell from MSTd (C), and one non-DDD neuron from VIP (D). Smooth curves represent Gabor function fits (see Materials and Methods). Gabor fits are shown for both directions of motion for DDD cells, but only for the maximum DDI direction for non-DDD cells.
