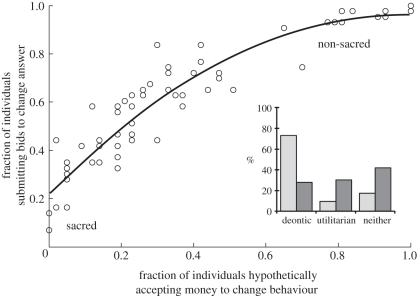
Figure 1.
Relationship of auction behaviour to hypothetical solicitation of money. Averaged over participants (n = 43), each point represents one pair of personal values. The fraction of individuals submitting auction bids to change their answer for a given pair is plotted against the fraction of individuals who indicated that hypothetically they would accept money to change the corresponding behaviour. These two measurements are highly correlated (adjusted R2 = 0.87 for quadratic). Items in the lower left (sacred) had a low percentage of individuals willing to accept either hypothetical or real money. These items pertained to the sanctity of human life, especially children. Items in the upper right (non-sacred) had a high percentage of individuals willing to accept both hypothetical and real money to change and represented utilitarian preferences (e.g. Coke versus Pepsi and dog versus cat). Despite this correlation, all of the points lie above the diagonal, indicating a hypothetical bias (participants sold more often than they said they would hypothetically). The mode of decision-making (inset) was significantly different for statements that were not auctioned (optout) versus those that were (bid) (F2,132 = 58.7, p < 0.001). Light grey bars, optout; dark grey bars, bid.

