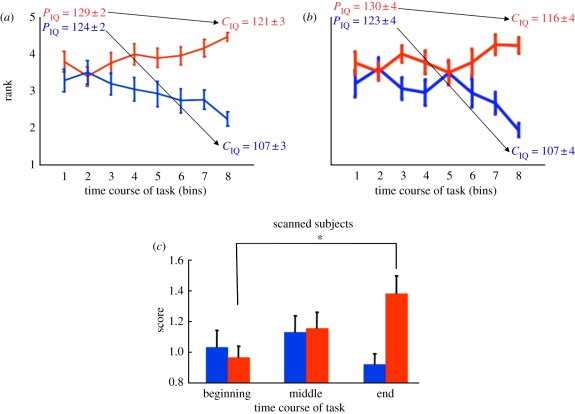
Figure 2.
Group intelligence quotient (IQ) task with ‘social status’ feedback demonstrates harmful influence on expressed IQ. (a) Subjects' final ranking identifies two groups with differentiated trajectories during the group IQ task. x-Axis: time course of the task, the experiment excluding the first 12 questions is divided into eight bins, each bin consisting of 10 trials; y-axis: rank as assessed in each of the eight bins. Two groups were defined by their rank at the end of the task (last bin): group 1 (n = 19) had a rank greater than the median (red), whereas group 2 (n = 20) had a rank less than or equal to the median (blue). Subjects in group 1 and group 2 were selected such that their baseline IQ scores (PIQ) were similar (i.e. group 1 and group 2 did not differ significantly on IQ scores derived from their pencil and paper-based test, ‘PIQ,group# = mean ± s.e.m.’: PIQ,group 1 = 129 ± 2 versus PIQ,Group 2 = 124 ± 2, p = 0.06, two-sample t-test). According to the performance on the ranked group IQ task (CIQ), group 1 subjects' mean IQ was determined to be ‘CIQ,group# = mean ± s.e.m.’: CIQ,group 1 = 121 ± 3, whereas group 2 subjects' mean IQ was determined to be CIQ,group 2 = 107 ± 3, which indicates a significant difference (p < 0.05). (b) A subset of scanned subjects (n = 27) showed similar rank changes in the group IQ task. Scanned subjects were divided into two groups by their rank at the end of the task as mentioned above. High performers (HP; n = 13) had a rank greater than the median (red). Low performers (LP, n = 14) had a rank less than equal to the median (blue). The two groups had similar baseline IQ (PIQ = mean ± s.e.m.): PIQ = 130 ± 4 in HP group versus PIQ = 123 ± 4 in LP group, p = 0.2, two-sample t-test; however, they showed a significant difference (p < 0.05) in expressed IQ by the end of the ranked group IQ task—‘CIQ (HP or LP) = mean ± s.e.m.’: CIQ,HP = 116 ± 4, CIQ,LP = 107 ± 4. (c) High performing subjects improve their performance during the ranked group IQ task. x-Axis: the experiment is divided into three epochs (beginning, middle and end); y-axis: normalized, difficulty adjusted cumulative scores for ranked group IQ task performance. Only fMRI-scanned subjects (n = 27) are plotted here and in subsequent analyses. As labelled in figure 2b, subjects ending with ranks > median define one group (red bars, n = 13, ‘HP’). Those ending with ranks ≤ median define the second group (blue bars, n = 14, ‘LP’). All subjects analysed here possessed similar baseline IQ scores. Initially, both groups perform poorly (see ‘beginning’ scores for both low and high performing groups). By the end of the ranked group IQ task, the high performing subjects (i.e. highest final ranks; red bars) steadily increased their performance (compare red bars at the beginning, middle and end) compared with the LP (i.e. lower final ranks; blue bars). Low performing subjects do not change their performance during the experiment (compare blue bars at the beginning, middle and end). Bar height and error bars indicate mean ‘difficulty adjusted score’ + s.e.m. Repeated-measure ANOVA showed significant group × time effect (p < 0.01) but no effect of group or time. *p < 0.05, post hoc with Bonferroni correction for multiple comparisons.

