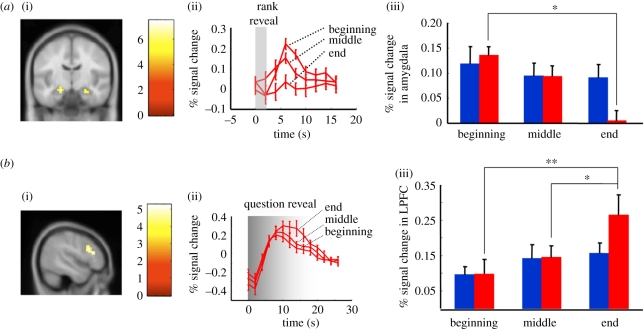
Figure 3.
Associated brain responses in subjects scanned during the ranked group IQ task. fMRI-scanned subjects were divided into two groups as described in figure 2b: subjects (n = 27) were divided into two groups according to their final rank; subjects ending with ranks > median are labelled by red bars (n = 13, HP), those ending with ranks ≤ median are labelled by blue bars (n = 14, LP). Random-effects general linear model (GLM) analyses including all 27 subjects identified the amygdala and lateral prefrontal cortex as regions whose response changed during the time course of the ranked group IQ task. (a) BOLD responses in the amygdala decrease in high performing subjects. (i) A random-effects GLM analysis including all scanned subjects (n = 27) with the contrast: ‘rank_beginning’ > ‘rank_end’ identified bilateral amygdala. (ii) Time course of the amygdala response to the ‘rank reveal’ screen in HP (x-axis: time in seconds; y-axis: percentage change in the BOLD response; bars and error bars indicate mean + s.e.m.). At t = 0, the subjects' rank was displayed; the traces show the amygdala response at early, middle and end stages of the test in HP. Repeated-measure ANOVA showed significant within-subject time effect (p = 0.002) and time × group effect (p = 0.02), but no significant group effect (p = 0.49). (iii) HP (red bars) amygdala activity (peak 4–10 s after rank reveal) decreased at the end of the experiment compared with the beginning (*p < 0.05; post hoc with Bonferroni correction). In contrast, the amygdala response from LP (blue bars) showed no significant changes throughout the task. (b) BOLD responses in the LPFC increase in high performing subjects. (i) A random-effects GLM analysis with the contrast: ‘question_reveal_end’ > ‘question_reveal_beginning’ identified the right-lateral prefrontal cortex (r-LPFC). (ii) Time course of the r-LPFC response to the ‘question reveal’ screen in subjects from high performers (x-axis: time in seconds; y-axis: per cent change in the BOLD response; bars and error bars indicate mean + s.e.m.). At t = 0, a question was displayed; the traces show the r-LPFC response at early, middle and end stages of the test in the high performers. Repeated-measure ANOVA showed significant within-subject time effect (p < 0.0001) and time × group effect (p = 0.007), but no significant group effect (p = 0.45). (iii) High performers (red bars), r-LPFC activity increased (10–18 s after the question was revealed) at the end of the experiment compared with the beginning and middle (**p < 0.0001, *p < 0.05, post hoc with Bonferroni correction). In contrast, the r-LPFC response from LP (blue bars) showed no significant changes throughout the task.

