
Figure 8.
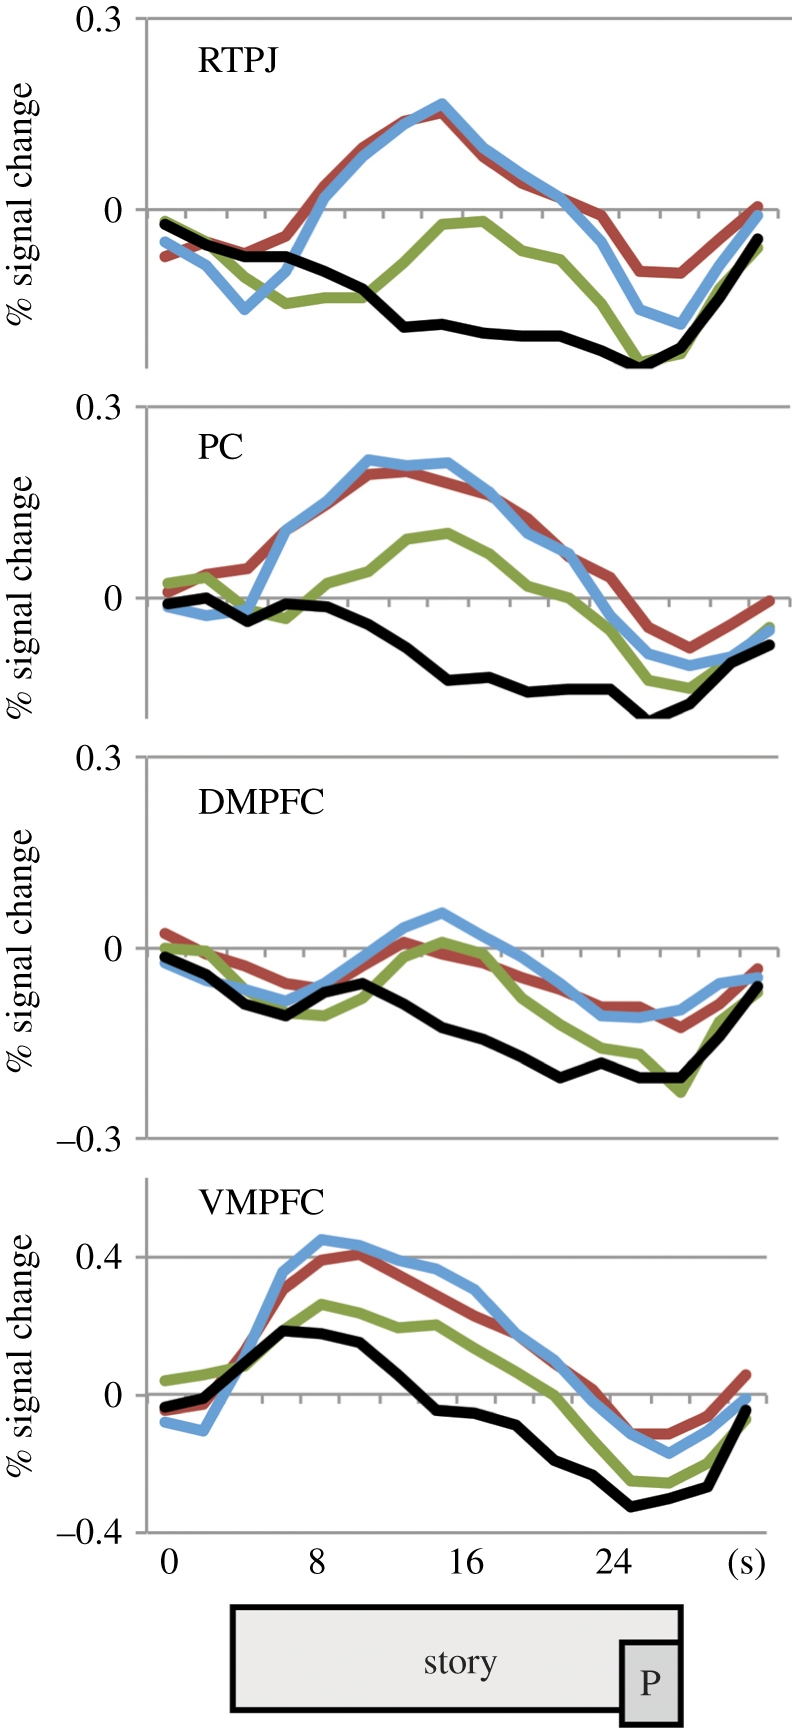
Time course of responses to stories about emotional suffering. The response over the duration of the story, in four representative regions, for Arab and Israeli participants (combined). Colours indicate the relative group membership of the story protagonist: the conflict outgroup (red), the distant outgroup (green) or the participant's ingroup (blue). Black lines show the time course for the no-pain control stories. The rectangles at the bottom show approximate timing of the story, and the compassion question prompt (P; shifted to account for haemodynamic lag).