
Figure 4.
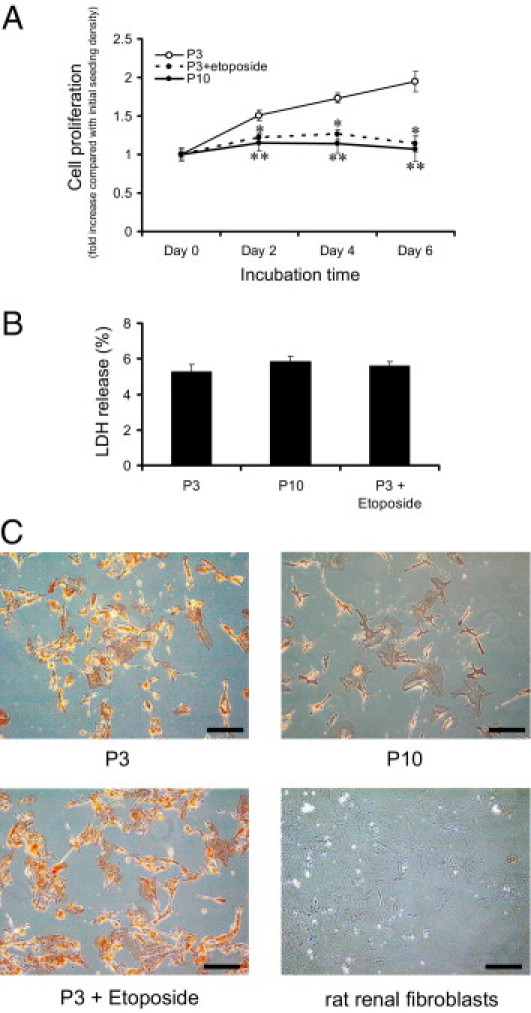
Validation of replicative senescence and senescence induced by etoposide in RPTECs. A: Cell proliferation rate determined by MTS assay showed replicative senescence at late passage (P10) and with exposure to a chemical senescence inducer, etoposide, at early passage (P3). Normal RPTECs doubled their population within 1 week, whereas senescent RPTECs and those exposed to etoposide did not proliferate. Assays were made at 2-day intervals, with the value on day 0 set as 1. *P < 0.01; **P < 0.05 versus day 0 of passage 3. B: LDH release was equivalent among RPTECs at passage 3 with or without etoposide exposure and at passage 10, excluding cells in which proliferation was halted because of cytotoxicity. LDH release = LDH in culture supernatant/(LDH in culture supernatant + LDH in cell lysate) ×100. C: Phase-contrast light micrographs with γ-GTP staining of RPTECs at passage 3 with or without etoposide exposure and at passage 10 and of rat renal fibroblasts confirmed that the cells retained the phenotype of proximal tubular cells. Original magnification = ×100. Scale bars: 200 μm. Red staining indicates cells positive for γ-GTP activity.