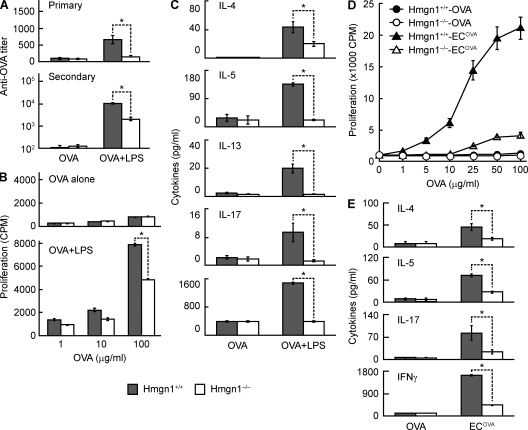
Figure 6.
Reduction of antigen-specific immune responses in HMGN1 KO mice. Male HMGN1 KO (Hmgn1−/−) and littermate-matched WT (Hmgn1+/+) mice (n = 3) were immunized i.p. with OVA (50 µg/mouse) in the presence or absence of LPS (1 µg/mouse) on day 1 and boosted i.p. on day 14. On day 10 and 20, mice were bled for the separation of serum samples, which were stored at −20°C until the measurement of primary and secondary OVA-specific IgG antibody response by ELISA. (A) Primary and secondary anti-OVA titers of Hmgn1+/+ and Hmgn1−/− mice after immunization. Shown are the results of one experiment representative of three (mean ± SD). *, P < 0.05 by ANOVA. (B) OVA-specific splenocyte proliferation of splenocytes of immunized Hmgn1+/+ and Hmgn1−/− mice. Pooled splenocytes of each group were cultured in triplicate in wells of a 96-well plate (5 × 10⁵/0.2 ml/well) in the presence of specified concentrations of OVA for 4 d. The culture was pulsed with 1 µCi/well [3H]TdR for the last 18 h before harvest for measurement of [3H]TdR incorporation. The results of one experiment representative of three are shown as the mean cpm (±SD) of triplicate wells. *, P < 0.05 by Student’s t test. (C) OVA-specific cytokine production by splenocytes of immunized Hmgn1+/+ and Hmgn1−/− mice. Splenocytes were cultured in a 48-well plate (2.5 × 10⁶/0.5 ml/well) in the presence of 100 µg/ml OVA for 48 h before the measurement of cytokines in the supernatants. Shown is the mean concentration (±SD) of cytokines (n = 3). *, P < 0.05 by ANOVA. (D and E) Male Hmgn1−/− and littermate-matched Hmgn1+/+ mice (n = 4) were immunized i.p. with OVA (50 µg/mouse) or radiation-inactivated OVA-expressing E. coli (106/mouse) on day 1 and boosted i.p. on day 14. Splenocytes pooled from the five mice were cultured in triplicate in wells of a 96-well plate (5 × 10⁵/0.2 ml/well) in the presence of specified concentrations of OVA for 4 d. The cultures were pulsed with 1 µCi/well [3H]TdR for the last 18 h before harvest for measurement of [3H]TdR incorporation. The results are shown as the mean cpm (±SD) of triplicate wells. *, P < 0.05 by Student’s t test. Alternatively, splenocytes were cultured in a 48-well plate (2.5 × 10⁶/0.5 ml/well) in the presence of 100 µg/ml of OVA for 48 h before the measurement of cytokines in the supernatants. Shown is the mean concentration (±SD) of cytokines (n = 5) of one experiment representative of two. *, P < 0.05 by ANOVA.

