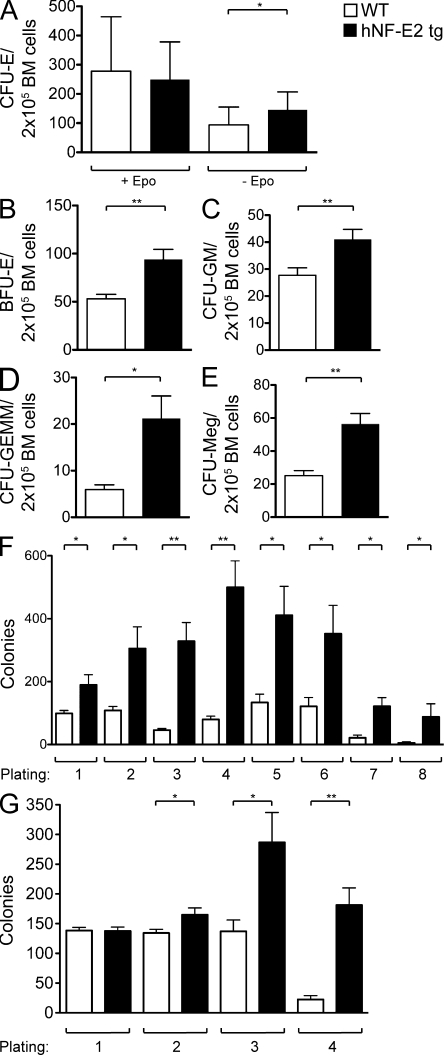
Figure 4.
Hematopoietic progenitor cell enumeration and replating capacity in NF-E2 tg and control mice. (A–E) BM cells were seeded in methylcellulose (A–D) or collagen medium (E) to determine colony-forming potential. All data include mice of both tg strains, 9 and 39; no differences were observed between the two tg strains. Before scoring, methylcellulose dishes were stained with benzidine to allow identification of CFU-E and BFU-E. CFU-E were scored on day 4, and BFU-E, CFU-GM, and CFU-GEMM were scored on day 8. CFU-Meg were scored on day 12. Mean and standard deviation of at least 10 independent mice of each genotype are shown. (A) CFU-E. (B) BFU-E. (C) CFU-GM. (D) CFU-GEMM. (E) CFU-Meg. (F and G) Replating capacity of BM from hNF-E2 tg and WT littermates in the FVB/N background (both 9 and 39; n = 4 and 7, respectively; F) and the C57BL/6 backcrossed background (n = 6 each; G). BM cells were seeded in methylcellulose, and the number of colonies was scored after 8 d. Subsequently, the cells were harvested and subjected to a second round of colony growth. After 8 d, colonies were again scored and replated for a third time. In total, eight rounds of replating were performed in FVB/N mice (F) and four rounds in C57BL/6 mice (G). Error bars indicate standard error of the mean. *, P < 0.05; **, P < 0.01.

